Pacific Aid Map
Overview
-
Project Year
2021
-
Duration
4.5 Months
-
Client Name
The Lowy Institute
-
Services Provided
Web Development,
Custom Backend Development -
Links
An analytical tool designed to enhance aid effectiveness in the Pacific!
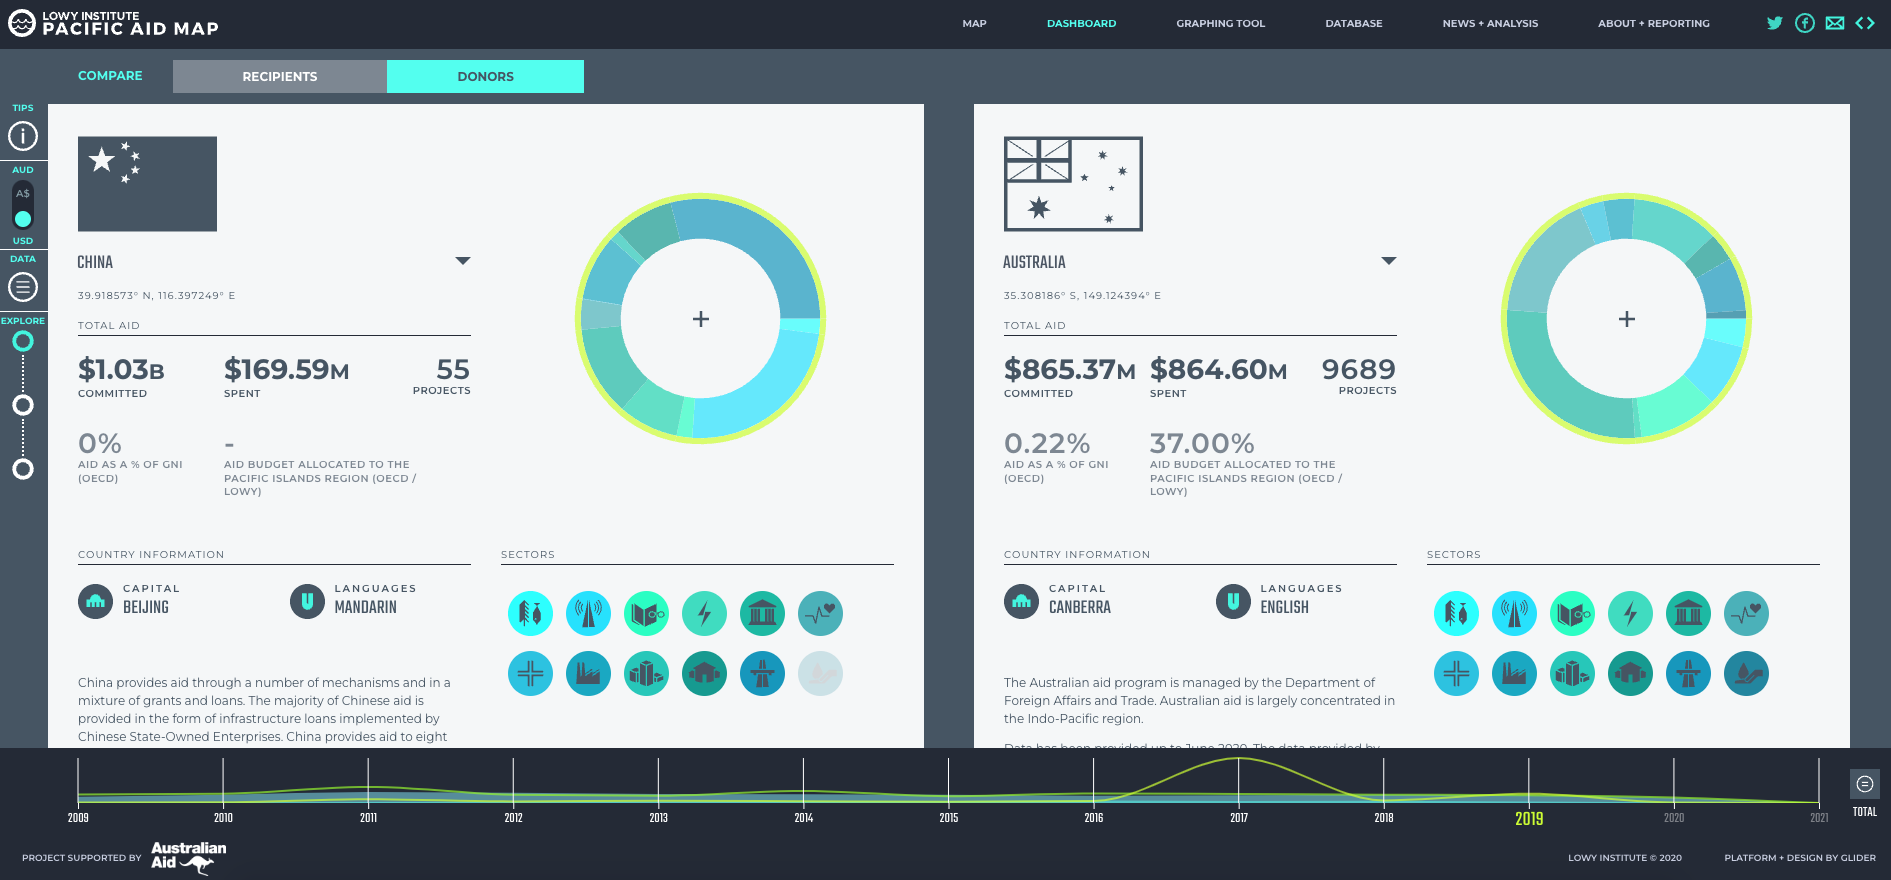
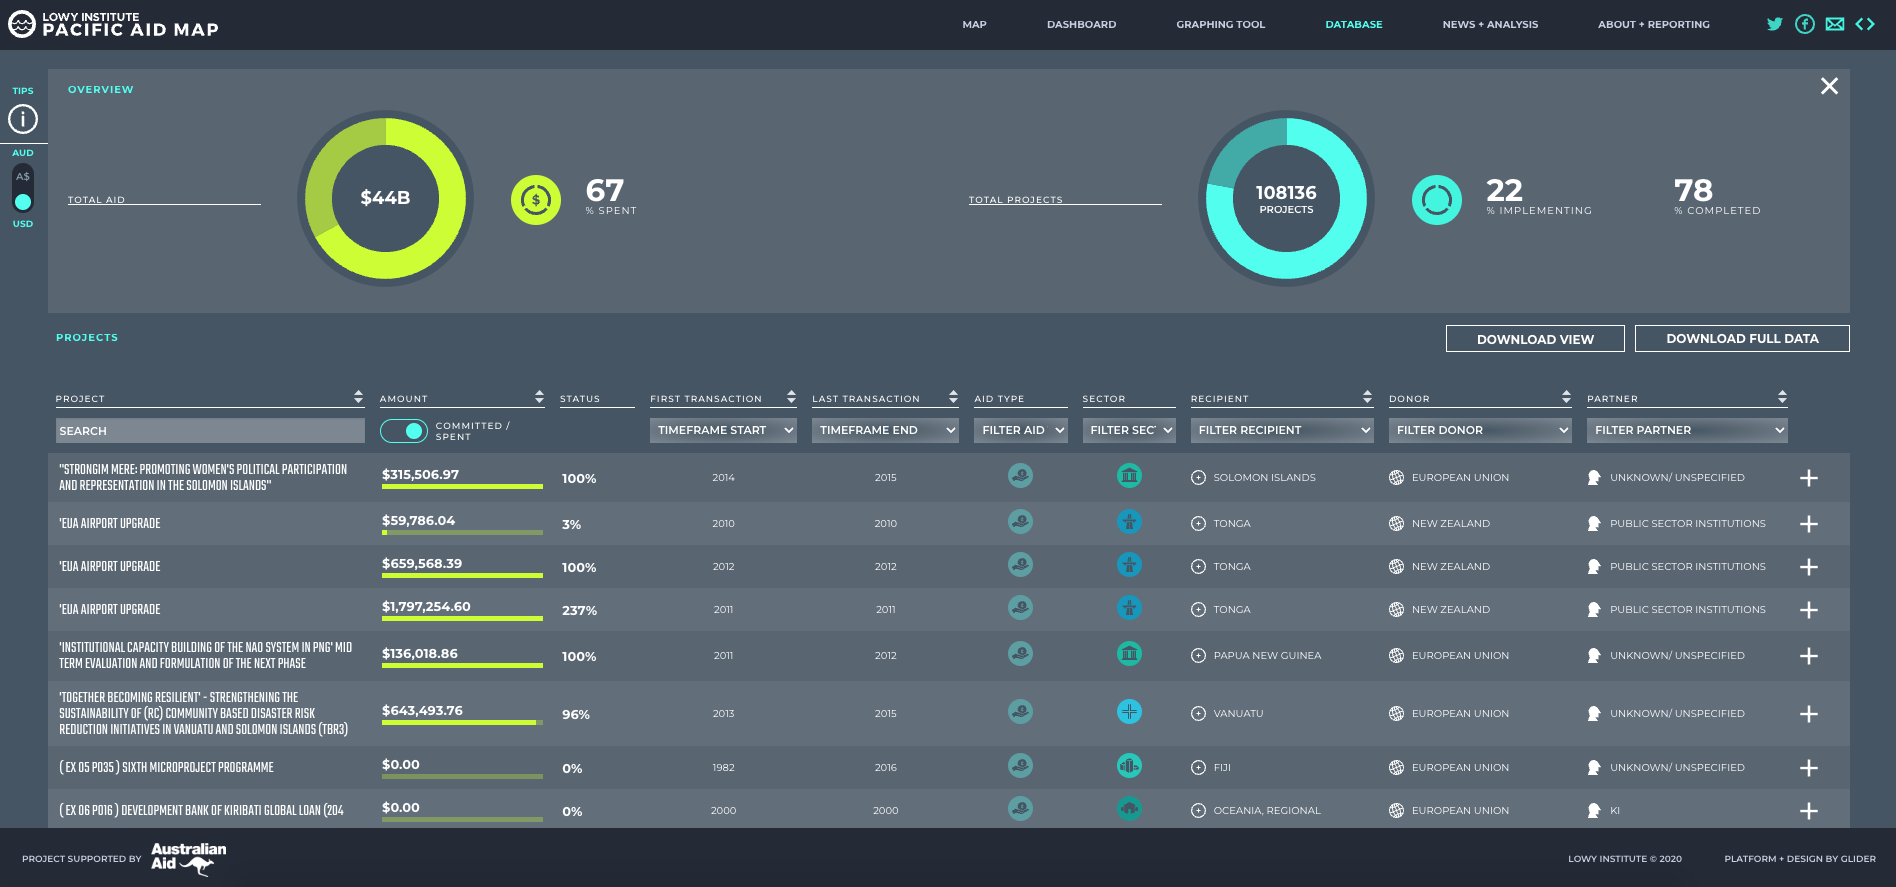
What is the Pacific Aid Map

The Lowy Institute Pacific Aid Map is an analytical tool designed to enhance aid effectiveness in the Pacific by improving coordination, alignment and accountability of foreign aid through enhanced transparency of aid flows. The Pacific Aid Map has collected data on close to 50,000 projects and activities in 14 countries from 66 donors from 2009 onwards. This raw data has been made freely available on this interactive platform, allowing users to drill down and manipulate the data in a variety of ways.
The Lowy Institute Pacific Aid Map will be updated on an annual basis for at least 2022 and 2023.
Principal researchers: Alexandre Dayant and Jonathan Pryke.
The authors would like to thank the critical research contributions of Jacob Stone, Lucie Greenwood, Wendy Xiao, Michael Phan Minh Ngyuen, Sulagna Basu, Tahi Izumi, Roland Rajah and Caitlin Gauci.
Special thanks also to the Pacific Islands Forum and the Pacific Regional Infrastructure Facility for their ongoing support.
The Institute would finally like to thank the Australian aid program for supporting this initiative.
Key Concepts

FOREIGN ASSISTANCE: The Pacific Aid Map (Aid Map) uses definitions of foreign assistance drawn from the Organisation for Economic Cooperation (OECD). The Aid Map takes a broad approach to the term foreign assistance – both Official Development Assistance and Other Official Flows are captured in the Pacific Aid Map.
DONORS: The Aid Map focuses exclusively on official agencies/donors. These come in two forms – bilateral and multilateral donors. Bilateral aid represents flows from official (government) sources directly to official sources in the recipient country. Multilateral aid represents core contributions from official (government) sources to multilateral agencies where it is then used to fund the multilateral agencies’ own programmes.
RECIPIENTS: The Pacific Aid Map focuses on independent states in the Pacific Islands region. At the time of starting the project this was in line with the membership of the Pacific Islands Forum, which were: Cook Islands, Fiji, Kiribati, Marshall Islands, Federated States of Micronesia, Nauru, Niue, Palau, Papua New Guinea, Samoa, Solomon Islands, Tonga, Tuvalu and Vanuatu.
Key Concepts
LOANS VS. GRANTS: Official assistance can come in both the form of a grant (i.e. transfers made in cash, goods or services for which no repayment is required) or a loan that must be eventually paid back. Loans can further be broken down into two categories: concessional and non-concessional, which are detailed in the methodology.
COMMITMENT VS. SPENT: There is an important distinction between what donors have committed in the region compared to what they have actually spent. Large commitments, typically in infrastructure, can often take a long time to disburse, and are then paid back over time which count as negative flows, meaning commitments can often overstate a donors overall footprint. Spent is a better indication of annual flows into the region. Not all donors effectively report on commitments, and for some donors such as China it is often hard to identify wha
SECTORS: Sectors have been drawn from the OECD sector categories and condensed from 16 to 12 for formatting purposes. Sectors are: Agriculture, Forestry & Fishing, Communication, Education, Energy, Government & Civil Society, Health, Humanitarian aid, Industry, Mining & Construction, Multisector/ Cross-cutting, Other/ Unspecified, Transport, Water & Sanitation. The approach is detailed in the methodology.
Data Caveats
On the date of the publication, data for most donors has only been provided up to and including 2019. Data for 2020 and 2021 is incomplete, and not representative of all aid flows to the region.
Data for non-traditional donors including China, India and Taiwan is likely to be incomplete. The Pacific Aid Map team has pieced together this information from a mixture of donor government announcements, recipient country budgets, news reports and social media sources. We are confident that it is the most robust dataset that has been compiled on these donors activities in the Pacific, but despite best efforts it is undoubtedly incomplete. Full details of how data on these donors was collected and verified is available in the methodology below.
Data that has been collected on Other Official Flows is also patchy. The OECD relies on donor self-reporting of OOF flows, and donors report into it to various degrees. It likely understates the actual volume of OOF being transferred to the region.
Data Caveats

The vast majority of donors do not provide information about the geolocation of projects. As a result, the Pacific Aid Map team has been forced to manually geolocate most projects in the Aid Map database. This is an imperfect solution for a number of reasons – precise location details are often not provided, certain types of projects are difficult to geocode into one place, and projects vary dramatically in their overall size. The exact method of how these projects have been geolocated is available in the methodology.
Given the patchy nature of demographic statistics across the region, the Institute has had to forecast some years of statistics for select Pacific Island countries. These instances have been detailed in the methodology below.
The Pacific Aid Map team has also had to manipulate data from specific donors to harmonise the data into the International Aid Transparency Initiative registry data format. See the methodology below for details on how data has been manipulated, if at all, from every donor.
Reporting

The Pacific Aid Map database is the most comprehensive database ever compiled on aid to the Pacific region. With that said it remains incomplete, and there are always more aid projects operating in the Pacific that have either not been reported by donors or otherwise publicly reported. There may also be errors or inconsistency in some of the data that the Pacific Aid Map has compiled.
The Pacific Aid Map team encourages users to provide us detail on these gaps. You can do this in a number of ways:
- You can fill in the information on a project in the interface below;
- You can download the data template, fill it out and email it to us;
- You can provide us an email with details of the project that we can track down and then input into the map.
Designs


More Case Studies

Changing Lives
Changing Lives Counselling understands that everyone has their own story to tell. By building a therapeutic relationship the counsellor can support individuals …
Read Case Study
HOW.
HOW. offers high-quality furniture and industrial design solutions for architects and interior designers.
Read Case Study
Travelarc
Travelarc is an online auction and promotion company that highlights the best destinations in Australia plus exclusive experiences. We make it easy …
Read Case Study